Resonance Chart of Single-Walled Carbon Nanotubes
(SWNTs)
|
|
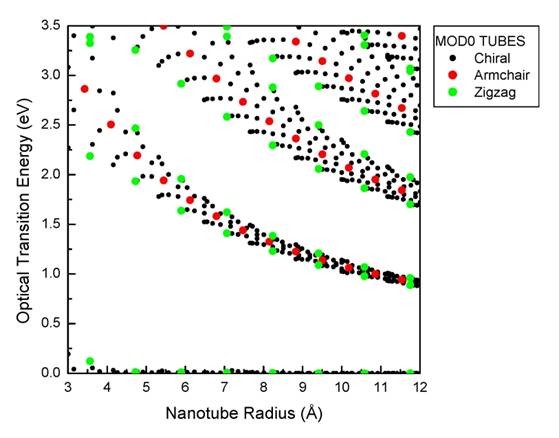
The optical transition energies of all SWNTs in the radius range from 0.3
nm to 1.2 nm were calculated using the symmetry-adapted non-orthogonal
tight-binding model [1,2]. Self-energy and excitonic corrections are not
included.
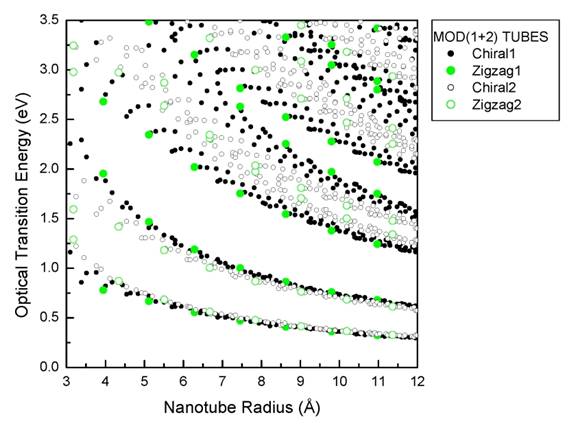
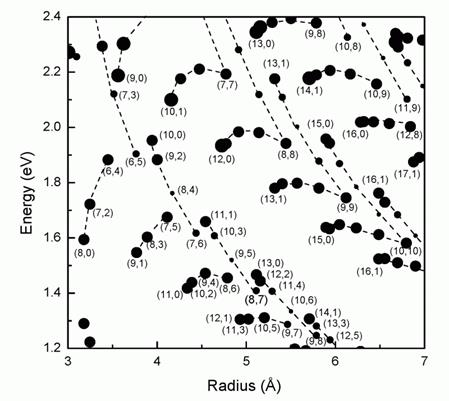
The results are given in Figs. 1 and 2 for Mod0 tubes (metallic tubes)
and Mod1 and Mod2 tubes (semiconducting tubes), respectively. A
zoomed-in part of both figures is shown in Fig. 3. These resonance charts are
also known as Kataura plots.
The comparison of the calculated optical transitions with
photoluminescence data showed that these corrections amount to an upshift of
about 0.3 eV for the first and second transitions in semiconducting tubes[2].
The optical transition
energies, derived within the non-orthogonal-tight-binding model, were
published in Ref. [3] (see, EPAPS)
The comparison to recent Raman data showed that these corrections are
larger for the higher optical transitions of semiconducting and metallic
tubes and an average upshift of about 0.45 eV was obtained[4]. This larger upshift is in favor of the
much smaller excitonic effects for optical transitions higher than E11 and
E22 of semiconducting tubes.
More experimental work is in progress to give more precise estimate of
the deviation of the non-orthogonal tight-binding results from the
experimental values thus throwing more light on the self-energy and excitonic
effects in nanotubes.
References 1. V. N. Popov, New J. Phys. 6 (2004) 17/1-17. 2. V. N. Popov and L. Henrard, Phys. Rev. B 70 (2004) 115407. 3. V. N. Popov, Luc Henrard, and Ph. Lambin,
Phys. Rev. B 72 (2005) 035436. 4. M. Paillet et al., Phys. Rev. Lett. 96 (2006) 257401 |
|
|
|
|
|
Valentin Popov