Double resonant Raman
scattering in graphene
|
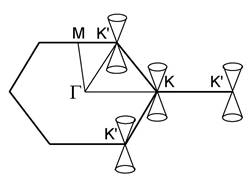
Fig. 1. Schematic representation of
the electronic band structure close to the Fermi energy: the conduction and
valence bands are cone-like (Dirac cones) with apices (Dirac points) at the K
and K' points of the hexagonal Brillouin zone of graphene. Some of the
special points of the Brillouin zone are also shown. |
INTRODUCTION Graphene has a single Raman-active phonon of
E2g symmetry, observed as an intense band in the Raman spectra.
Apart from this band, the spectra exhibit a few other bands originating from
double resonant scattering processes (Thomsen and Reich, 2000). The double resonant processes are favoured by
the specific cone-like electronic bands (Dirac cones) close to the Fermi energy
(Dirac points) (Fig. 1). A double resonant
process comprises several virtual ones: absorption of an incident photon with
creation of an electron-hole pair, double scattering of the created
electron/hole by phonons, and recombination of the electron-hole pair with
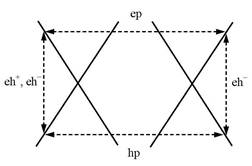
emission of a photon. There are altogether eight such processes (Fig. 2). The
processes with one "ep" process and one "hp"
process give major contribution to the Raman intensity. We calculate the
electronic band structure, phonon dispersion, electronic lifetime and double
resonant Raman intensity within the non-orthogonal tight-binding (NTB) model
[1,2,3]. This model uses ab-initio derived matrix
elements and has no adjustable parameters except for the downscaling
parameter of 0.9 for the phonon frequencies. The dynamical matrix uses
electronic response to the ionic displacement, derived in first-order
perturbation theory. The Raman intensity is derived in fourth-order
perturbation theory. The electron-photon and electron-phonon matrix elements
are calculated within the NTB model [3]. |
|
|
|
|
|
|
|
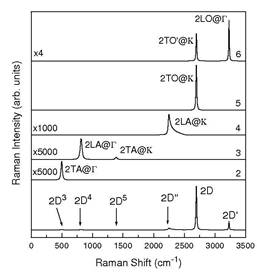
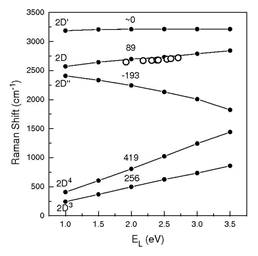
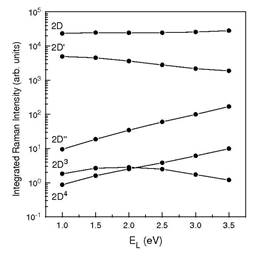
Fig. 4. Calculated overtone Raman
spectra at laser photon energy of 2.0 eV. The graphs show the contributions
to the spectra from two phonons from the same branch labeled by 1,2,…,6. |
Overtone double resonant Raman spectrum The overtone spectrum is due to two phonons from the same branch, labeled by 1,2,…,6 (Fig. 4) [3]. The major contributions to the spectrum come from the 5th branch close to the K point (2TO@K and 2TO'@K phonons) and the 6th branch close to the Γ point (2LO@Γ phonons). The former give rise to the 2D band, and the latter give rise to the 2D' band. The double scattering processes by 2TO@K phonons are usually called inner processes and those by 2TO'@K phonons are called outer processes. The contribution from inner processes is about an order of magnitude larger than that from outer processes. Recently, this has been confirmed experimentally (Berciaud, 2013, arXiv). |
|
|
|
|
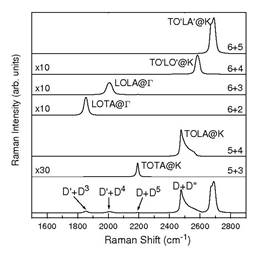
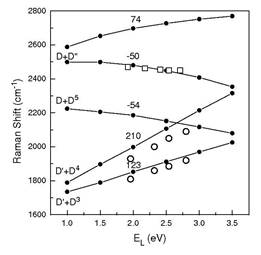
Fig. 6. Calculated combination Raman
spectra at laser photon energy of 2.0 eV.
The graphs show the contributions to the spectra from two phonons from
two different branches labeled by 1,2,…,6. |
COMBINATION double resonant Raman spectrum The combination spectrum is due to two phonons from two different branches, labeled by 1,2,…,6 (Fig. 6) [3]. The largest contributions to the spectrum come from TO'LA'@K and TOLA@K phonons. The former is not observed as a separate band because it overlaps with the much more intense 2D band. The TOLA@K and TO'LO'@K give rise to the D+D" band - a result, which has recently been confirmed theoretically (May, 2013). The remaining contributions are at least one order of magnitude smaller and are rarely observed (Sato, 2011). |
|
|
|
|
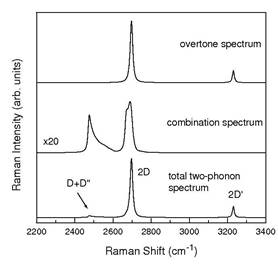
Fig. 8. Calculated total Raman
spectra at laser photon energy of 2.0 eV.
The graphs show the contributions to the spectra from the overtone and
combination spectra. |
TOTAL DOUBLE RESONANT RAMAN SPECTRUM The total double resonant Raman spectrum exhibits mainly three measurable bands: D+D", 2D, and 2D'. The 2D band is the most intense among the three and is always observed. Two of our results have been confirmed recently (Berciaud, 2013; May, 2013) in support of the use of our NTB model for Raman spectra calculations. References: 1. V. N. Popov, New J. Phys. 6 (2004) 1-17. 2. V. N. Popov and L. Henrard, Phys. Rev. B 70 (2004) 115407. 3. V. N. Popov and Ph. Lambin, Eur.
Phys. J. B 85 (2012) 418/1-8. |
Valentin Popov