2D Raman band of strained
graphene
|
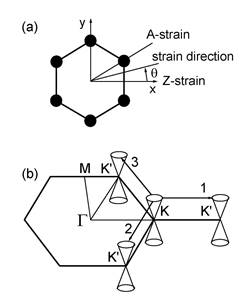
Fig. 1. (a) The hexagonal atomic
structure of graphene. The strain direction is defined by the angle θ
relative to the x axis. The limiting cases of A and Z strain are also shown. (b) Schematic representation of the electronic band structure of graphene close to the Fermi energy: the conduction and valence bands are cone-like (Dirac cones) with apices (Dirac points) at the K and K' points of the hexagonal Brillouin zone of graphene. In a double resonant Raman process an electron/hole is scattered along paths 1, 2, and 3. The three scattering paths become non-equivalent under uniaxial strain. |
INTRODUCTION Graphene has a single Raman-active phonon of
E2g symmetry, observed as an intense band in the Raman spectra.
Apart from this band, the spectra exhibit a few other bands originating from
double resonant scattering processes (Thomsen and Reich, 2000). Under
uniaxial strain, the Raman bands are modified. In particular, the 2D band is
shifted and split. The uniaxial strain geometry is shown in Fig. 1a. The double resonant processes are favoured by
the specific cone-like electronic bands (Dirac cones) close to the Fermi
energy (Dirac points) (Fig. 1b). A double resonant process comprises several
virtual ones: absorption of an incident photon with creation of an
electron-hole pair, double scattering of the created electron/hole by
phonons, and recombination of the electron-hole pair with emission of a
photon. There are altogether eight such processes. |
|
|
We calculate the electronic band structure,
phonon dispersion, electronic lifetime and double resonant Raman intensity of
strained graphene within the non-orthogonal tight-binding (NTB) model [1,2,3]. This model uses ab-initio derived matrix elements
and has no adjustable parameters except for the downscaling parameter of 0.9
for the phonon frequencies and 0.8 for the shift rate and the dispersion
rate. The dynamical matrix uses electronic response to the ionic
displacement, derived in first-order perturbation theory. The Raman intensity
is derived in fourth-order perturbation theory. The electron-photon and
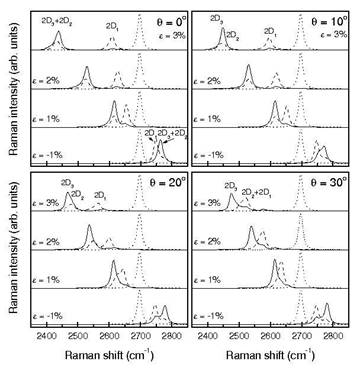
electron-phonon matrix elements are calculated within the NTB model [3]. 2D RAMAN BAND OF STRAINED GRAPHENE In unstrained graphene, the scattering paths
1, 2, and 3 give equal contribution to the 2D band. In strained graphene, the
paths 1, 2, and 3 generally give different contribution. As a result, the 2D
band is shifted and split into three components 2D1, 2D2, and 2D3 (Fig. 2). The three components
generally depend on the strain magnitude ε, strain angle θ,
and the laser photon energy EL [4,5]. |
|
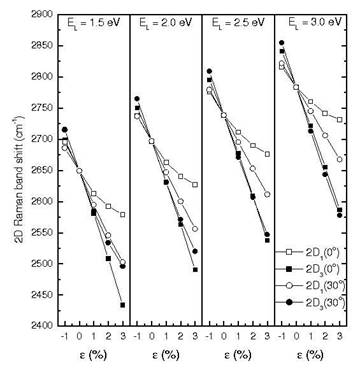
Fig. 3. Calculated Raman shift of
subbands 2D1 and 2D3 (circles and squares) as a
function of the strain magnitude ε at θ = 0о
and 30о, and at different values of the laser photon energy
EL. The lines are guides to the eye. |
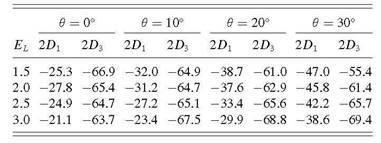
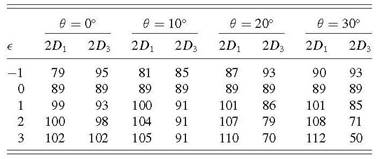
SHIFT The calculated Raman shift of the 2D subbands as a function of the strain magnitude ε at different strain directions θ and laser photon energy EL are given in Fig. 3 [5]. The obtained data can be characterized by the slope of the curves, so-called shift rate. The shift rates, derived from Fig. 3, are given in Table I. Table I. Shift rates (in cm-1) of subbands 2D1 and 2D3 at different values of θ and EL.
|
|
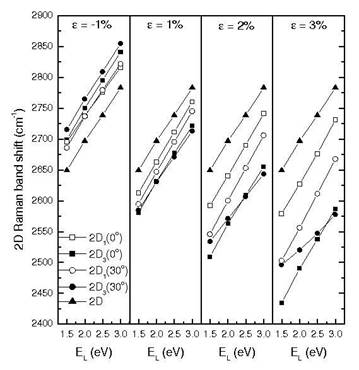
Fig.4. Calculated Raman shift of
subbands 2D1 and 2D3 (circles and squares) as a
function of the laser photon energy EL at θ = 0о
and 30о, and at different values of the strain magnitude
ε. The triangles are the shifts of the 2D band of unstrained graphene.
The lines are guides to the eye. |
DISPERSION The calculated Raman shift of the 2D subbands as a function of the laser photon energy EL at different strain magnitude ε and strain directions θ are given in Fig. 4 [5]. The obtained data can be characterized by the slope of the curves, so-called dispersion rate. The dispersion rates, derived from Fig. 4, are given in Table II. Table II. Dispersion rates (in cm-1/eV) of subbands 2D1 and 2D3 at different values of θ and ε.
|
|
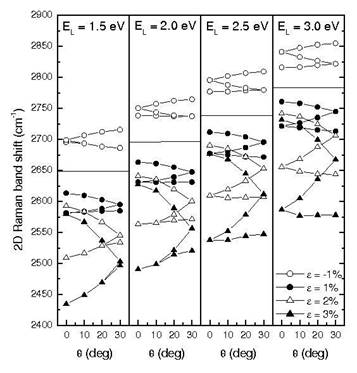
Fig. 5. Calculated Raman shift of the
2D subbands (symbols) as a function of θ at different values of ε
and EL. The three branches at a given strain magnitude are the
shifts of subbands 2D1, 2D2, and 2D3 in
order of increasing (decreasing) shift at ε < 0
(ε > 0). The horizontal lines are drawn at the Raman shift
of unstrained graphene. |
SHIFT OF THE 2D BAND AS A FUNCTION OF θ Finally, the Raman shifts of the 2D subbands can be shown as a function of the strain direction θ (Fig. 5). The curves follow periodic patterns, which can be fitted by trigonometric functions [5]. Our shift rates and dispersion rates correspond fairly well to the scarce available experimental data (Mohiuddin, 2009; Huang, 2010; Frank, 2010; Yoon, 2011). Our study shows that the shift rates and dispersion rates essentially depend on the experimental conditions. The predicted rates can be used for the purposes of future application of graphene in nanoelectronics devices.
References: 1. V. N. Popov, New J. Phys. 6 (2004) 1-17. 2. V. N. Popov and L. Henrard, Phys. Rev. B 70 (2004) 115407. 3. V. N. Popov and Ph. Lambin, Eur. Phys. J. B 85 (2012) 418. 4. V. N. Popov and Ph. Lambin, Carbon 54 (2013) 86. 5. V. N. Popov and Ph. Lambin, Phys. Rev.
B 87 (2013) 155425/1-7 |
Valentin Popov