Frequencies of Γ-phonons of single-walled carbon nanotubes
|
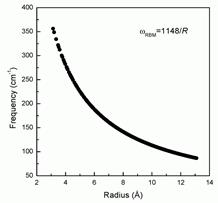
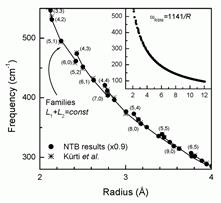
Fig. 1. Left: RBM frequency of SWNTs, calculated within a valence-force field model of the lattice dynamics, vs nanotube radius[1]. Right: RBM derived within a non-orthogonal tight-binding model[6]. |
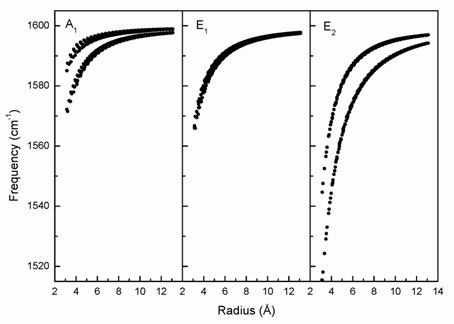
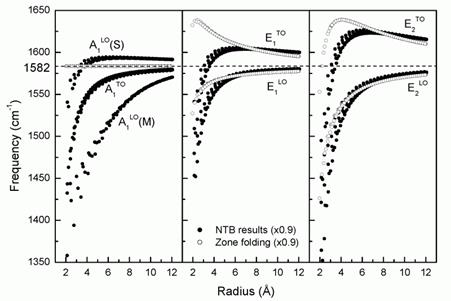
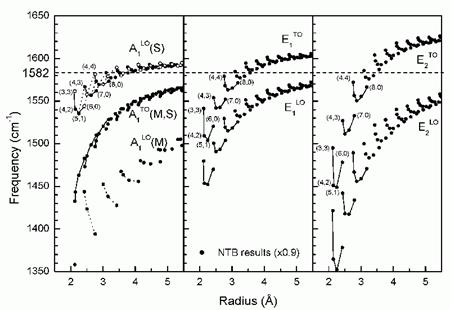
The single-walled carbon nanotubes (SWNTs) have a number of Raman-active phonons, among which the radial-breathing mode (RBM) and up to six modes, called the G modes, are normally observed in the Raman spectra. The G modes are observed as a few features in a narrow frequency range between 1500 and 1600 cm-1, which are termed the G band. The RBM of single-walled carbon nanotube is a uniform radial motion of the atoms of the entire tube. The importance of this mode is due to a) its Raman activity and high Raman intensity and b) the dependence of its frequency on the tube radius R, which follows roughly the simple power law 1/R [1,2] (see Figs. 1 and 2). For small radii, the phonon frequencies show well-expressed family patterns for L1+L2=const. In multiwall nanotubes and in bundles of tube, the intertube interactions modify the RBM frequency of the isolated tube and give rise to various types of collective breathing motion of the tubes [3,4,5]. The G-band phonon modes comprise the Raman-active phonon modes of the single-walled carbon nanotubes of bond-stretching character and tangential atomic displacement. These modes are between three (armchair and zigzag tubes) and six (chiral tubes) in number. They are almost independent of radius and chirality, at least for tube radii larger than about 0.7 nm. For smaller radii, the phonon frequencies show well-expressed family patterns for L1+L2=const. The G-band modes are of symmetry species A1g+E1g+E2g (armchair and zigzag tubes) and 2A1+2E1+2E2 (chiral tubes). The force-constant and tight-binding results for the G-band modes frequencies show softening at small tube radii. Essential difference is the splitting of the A1(LO) strip into a strip of semiconducting tubes and a lower-frequency strip of metallic tubes. The E1 and E2 modes do not exhibit splitting. These modes do not have significant Raman intensity because they are observed for scattering geometry with a polarizer and/or an analyzer perpendicular to the tube axis, when the electronic response is largely suppressed. Therefore, the high-frequency region of the Raman spectrum is due predominantly to the A1 modes. Fig. 3 gives an interesting indication for the observed G-band: it consists of a high-frequency G+ subband at about 1593 cm-1 due to A1(LO) phonons of semiconducting tube and a lower-frequency G− subband splitting by itself into a subband of A1(TO) phonons of metallic and semiconducting tubes centered at 1570 cm-1 and a subband of A1(LO) phonons of metallic tubes centered at 1550 cm-1. The small-radius region of the G-band modes frequencies is shown in Fig. 4 where family patterns (points with L1+L2=const connected with lines) are clearly seen. As in the case of the RBM, armchair tubes or close-to-armchair tubes have highest frequencies within a given family. Due to the strong electron - LO phonon interactions, the A1(LO) branch of armchair tubes has a log singularity at the Brillouin zone center within the non-orthogonal tight-binding model. This artifact is due to the impossibility to describe screened electron-electron Coulomb interactions in this model. However, the positions of the points of armchair tubes, as obtained from the fitting of the frequencies, are shown with empty circles in Fig. 4. References: 1. V. N. Popov, V. E. Van Doren, and M.
Balkanski, Phys. Rev. B 59
(1999) 8355-8358. 2. V. N. Popov, V. E. Van Doren, and M.
Balkanski, Phys. Rev. B 61
(2000) 3078-3084. 3. V. N. Popov and L. Henrard, Phys. Rev. B 63 (2001) 233407-233410. 4. L. Henrard, V. N. Popov, and A. Rubio, Phys. Rev. B 64 (2001) 205403/1-10. 5. V. N. Popov and L. Henrard, Phys. Rev. B 65 (2002) 235415/1-6. 6. V. N. Popov and Ph. Lambin, Phys. Rev. B 73 (2006) 085407. |
|
Fig. 2. G-band modes of SWNTs (valence force field model) vs tube radius[1]. |
|
|
Fig. 3. G-band modes frequency of SWNTs (non-orthogonal tight-binding model) vs tube radius[6]. |
|
|
Fig. 4. G-band modes frequency of SWNTs (non-orthogonal tight-binding model, NTB) vs tube radius (small-radius region)[6]. The empty circles show the position of the points for armchair tubes according to the fitting output. Armchair tubes have log singularity of the A1(LO) branch at the zone center within the NTB model. |
Valentin Popov