Two-phonon resonant Raman scattering in graphene
|
|
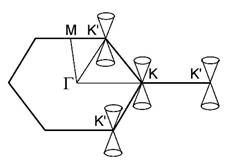
Graphene has a single Raman-active phonon of E2g symmetry, observed as an intense band in the Raman spectra. Apart from this band, the spectra exhibit a few other intense bands due to two-phonon Raman scattering. It has been argued that the enhancement of the two-phonon Raman bands of graphene is due to the specific electronic band structure of graphene with cone-like electronic bands (Dirac cones) close to the Fermi energy (Dirac points) (Fig. 1). The origin of the enhancement of the two-phonon Raman processes can be revealed by considering the Raman scattering process from a quantum-mechanical point of view. In the quantum-mechanical description of the Raman process, one takes into account the electrons, photons and phonons of the system, and their interactions. The resonant Raman intensity for Stokes processes is derived in fourth-order quantum-mechanical perturbation theory (Martin & Falicov, 1983)
Here, The Raman
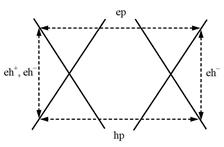
scattering process can be represented as several virtual ones: absorption of
an incident photon with creation of an electron-hole pair, double scattering
of the created electron/hole by phonons, and recombination of the
electron-hole pair with emission of a photon. There are altogether eight such
processes. For four of the processes, an electron is scattered twice by two
phonons with opposite momenta or a hole is scattered twice by two phonons
with opposite momenta. It can be shown that, in the denominator of the
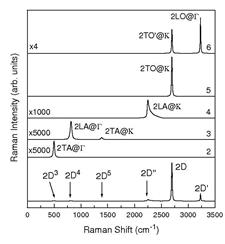
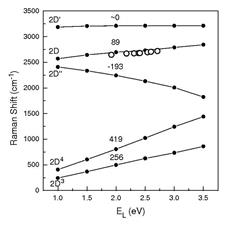
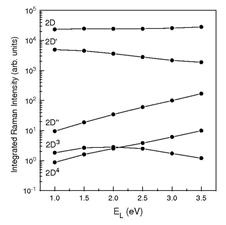
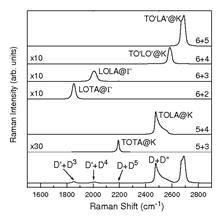
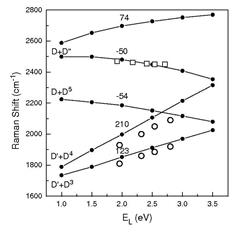
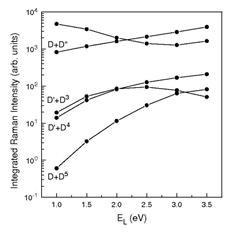
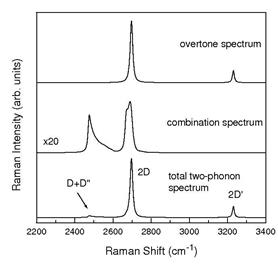
intensity, the real part of two Figure 4 shows the overtone two-phonon Raman spectrum of graphene, which is due to two phonons from the same branch, labeled by 1,2,…,6 [5]. The major contributions to the spectrum come from the 5th branch close to the K point (2TO@K and 2TO'@K phonons) and the 6th branch close to the Γ point (2LO@Γ phonons). The former give rise to the 2D band, and the latter give rise to the 2D' band. Figure 5 shows the dependence of the Raman shift and the Raman intensity of the overtone bands on the laser excitation. The calculated values are in excellent agreement with the available experimental data. The double scattering processes by 2TO@K phonons are usually called inner processes and those by 2TO'@K phonons are called outer processes. The contribution from inner processes is about an order of magnitude larger than that from outer processes. Recently, this has been confirmed experimentally (Berciaud, 2013). Figure 6 shows the combination two-phonon Raman spectrum of graphene, which is due to two phonons from two different branches, labeled by 1,2,…,6 [5]. The largest contributions to the spectrum come from TO'LA'@K and TOLA@K phonons. The former is not observed as a separate band because it overlaps with the much more intense 2D band. The TOLA@K and TO'LO'@K give rise to the D+D" band - a result, which has recently been confirmed theoretically (May, 2013). The remaining contributions are at least one order of magnitude smaller and are rarely observed (Sato, 2011). Figure 7 shows the dependence of the Raman shift and Raman intensity of the combination bands on the laser excitation. The calculated values are in excellent agreement with the existing experimental data. Figure 8 shows the total two-phonon Raman spectrum, which exhibits mainly three measurable bands: D+D", 2D, and 2D'. The 2D band is the most intense among the three and is often observed. References: 1. V. N. Popov and L. Henrard, Phys. Rev. B 70 (2004) 115407. 2. V. N. Popov, L. Henrard, and Ph. Lambin, Phys. Rev. B 72 (2005) 035436. 3. V. N. Popov and Ph. Lambin, Phys. Rev. B 73 (2006) 085407 4. V. N. Popov and Ph. Lambin, Phys. Rev. B 74 (2006) 075415 5. V. N. Popov and Ph. Lambin, Eur. Phys. J. B 85 (2012) 418. |
|
|
|
|
|
|
|
|
|
|
|
|
|
|
|

Valentin Popov