Two-phonon resonant Raman scattering in graphene – effect of strain
|
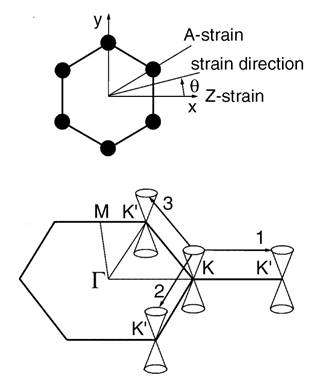
Fig. 1. Left: Atomic structure of graphene; the
angle θ defines the strain direction. Right: Schematic of the conduction
and valence bands around the Fermi energy at the K and K' points of the
hexagonal Brillouin zone of graphene. |
The two-phonon Raman spectra of graphene show a few observable bands. Among them, the so-called 2D band has the highest Raman intensity, which is in perfect graphene is up to six times larger than that of the only one-phonon band of graphene – the G band. The enhancement of the 2D band has been explained with the characteristic electronic band structure of graphene, exhibiting cone-like electronic bands (Dirac cones) close to the Fermi energy (Dirac points) (Fig. 1) as well as with the strong coupling of electrons with in-plane transverse optical (TO) phonons. The origin of the enhancement of the two-phonon Raman processes in graphene can be revealed by considering the Raman scattering process from a quantum-mechanical point of view. In the quantum-mechanical description of the Raman process, one takes into account the electrons, photons and phonons of the system, and their interactions. The resonant Raman intensity of the two-phonon bands can be derived in fourth-order quantum-mechanical perturbation theory (Martin & Falicov, 1983). The enhancement of the intensity comes from vanishing of the denominator of some of the perturbation terms, resulting in single, double, and triple resonance behavior. The two-phonon terms in the perturbation theory can be represented as a sequence of virtual processes: absorption of an incident photon with creation of an electron-hole pair, double scattering of the created electron/hole by phonons, and recombination of the electron-hole pair with emission of a photon. There are altogether eight such processes. For four of these processes, an electron is scattered twice by two phonons with opposite momenta or a hole is scattered twice by two phonons with opposite momenta. For certain electron and phonon wavevectors and energies, the condition for double resonance is fulfilled, producing increase of the intensity. For four of the processes, an electron and a hole are scattered by two phonons with opposite momenta. In this case, triple resonance is possible and the latter four processes give dominant contribution to the Raman intensity. Here, the
electronic band structure, phonon dispersion, matrix elements of the
electron-photon and electron-phonon coupling, as well as the electronic
broadening parameter, necessary for evaluation of the perturbation terms, were
all derived within the
non-orthogonal tight-binding (NTB) model [1-4]. The 2D
band of graphene, studied within the NTB model, and the characteristic
behavior of Raman shift and shape with the laser excitation were reported in
detail [5]. In particular, electron scattering between the closest parts of
the Dirac cones, so-called inner
processes, depicted in Fig. 1, give much larger contribution than
scattering between the distant parts of the Dirac cones, so-called outer processes (not shown). Secondly,
the three scattering paths 1, 2, and 3 in Fig. 1 have equal contributions to
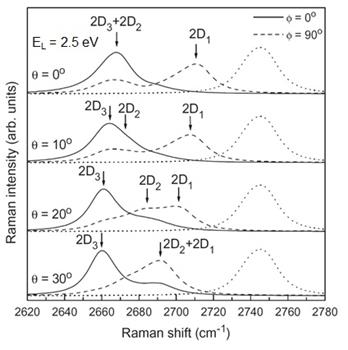
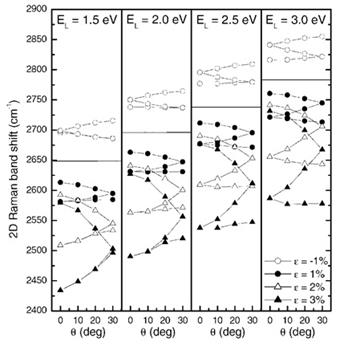
the 2D band giving rise to a symmetric shape of this band. Here, we consider in-plane uniaxial strain at an angle θ with respect to a zigzag of carbon bonds [6]; θ varies from 0°, so called zigzag direction, to 30°, so-called armchair direction. In uniaxially strained graphene, the scattering paths 1, 2, and 3 in Fig. 1 are no longer equal and electrons are scattered by phonons with different wavevector and different frequency. Therefore, the 2D band generally comprises three subbands, denoted here as 2D1, 2D2, and 2D3, coming from scattering processes along the three paths. Figure 2 shows the calculated 2D band for tensile strain of 1% along different strain directions θ and for parallel light polarization along and perpendicular to the strain direction (polarization angle ϕ = 0° and 90°) at laser excitation EL = 2.5 eV. At θ = 0°, there are only two subbands 2D3 + 2D2, and 2D1; at 0° < θ < 30°, three subbands 2D1, 2D2, and 2D3 can be observed; at θ = 30°, only subbands 2D3 and 2D2 + 2D1 can be observed. The applied tensile strain results in red shifting of the Raman shift of the subbands. The splitting of the subbands is up to a few tens of cm-1. The derived overall splitting corresponds to the experimentally observed one, though mostly two subbands have been identified. Figure 3 shows the calculated Raman shifts [7]. They can be fitted nicely with the expressions [6]:
where A = 2661.4 cm-1
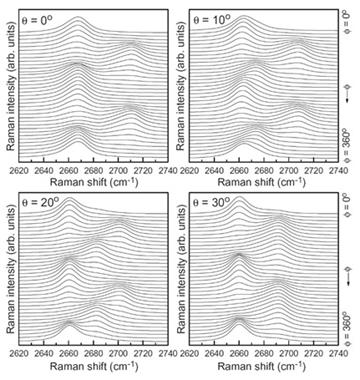
and B = 51.0 cm-1. These expressions allow deriving the shift rates Figure 4 shows the calculated polarization dependence of the intensity [6]. It can be shown that the intensity of the 2D band of unstrained graphene is polarization-dependent:
wherefrom the ratio of the intensity for cross and parallel polarization is 1/3. Furthermore, the polarization dependence of the 2D subbands can be expressed as:
The calculated data in Fig. 4 follow closely these expressions and agree well with the available experimental data. References: 1. V. N. Popov and L. Henrard, Phys. Rev. B 70 (2004) 115407. 2. V. N. Popov, L. Henrard, and Ph. Lambin, Phys. Rev. B 72 (2005) 035436. 3. V. N. Popov and Ph. Lambin, Phys. Rev. B 73 (2006) 085407 4. V. N. Popov and Ph. Lambin, Phys. Rev. B 74 (2006) 075415 5. V. N. Popov and Ph. Lambin, Eur. Phys. J. B 85 (2012) 418. 6. V. N. Popov and Ph. Lambin, Carbon 54 (2013) 86 7. V. N. Popov and Ph. Lambin, Phys. Rev. B 87 (2013) 155425. |
|
|
|
|
|
|
|
|
Valentin Popov
June 15, 2013